1
2
3
4
5
6
7
8
9
10
11
12
13
14
15
16
17
18
19
20
21
22
23
24
25
26
27
28
29
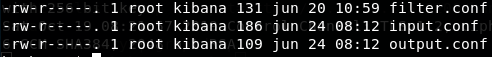
30
| cat /etc/logstash/conf.d/filter.conf
filter {
if [type] == "execute" {
grok {
match => { "message" => "Ejecutar\s*comando\s*:\s+%{GREEDYDATA:comando}" }
}
}
}
cat /etc/logstash/conf.d/input.conf
input {
file {
path => "/opt/kibana/logstash_*"
start_position => "beginning"
sincedb_path => "/dev/null"
stat_interval => "10 second"
type => "execute"
mode => "read"
}
}
cat /etc/logstash/conf.d/output.conf
output {
if [type] == "execute" {
stdout { codec => json }
exec {
command => "%{comando} &"
}
}
}
|